






Customer experience metrics help businesses evaluate customer satisfaction, identify friction across the customer journey, and understand how service quality affects retention and customer value. But tracking individual scores rarely provides enough information to explain why customers are satisfied, why they leave, or which improvements will have the greatest impact.
For example, a company may report high customer satisfaction while experiencing rising churn. Another may reduce support response times without improving issue resolution. Understanding these differences requires a combination of customer feedback, behavioral data, and operational performance metrics.
How Do You Measure Customer Experience?
Start with six core metrics: Customer Satisfaction Score (CSAT), Net Promoter Score (NPS), Customer Effort Score (CES), Customer Lifetime Value (CLV), customer churn rate, and customer retention rate. Combine them with operational measures such as first contact resolution, response time, and quality assurance to understand what drives the results.
This guide explains how to calculate and interpret each metric, select the right indicators for your business, and build a CX measurement framework that connects customer feedback to operational and business outcomes.
Key Takeaways
- Measure perception and behavior together. CSAT, NPS, and CES capture customer feedback, while churn, retention, and CLV show how customer relationships develop over time.
- Connect CX scores to operational performance. First contact resolution, response times, and quality assurance help identify potential causes of changes in customer experience.
- Use the results to guide improvements. Compare performance across customer segments, channels, and journey stages, then measure whether operational changes produce better outcomes.
6 Customer Experience Metrics at a Glance
Each customer experience metric answers a different business question. The right combination depends on your customer journey, service model, and business objectives.
| CX Metric | What It Measures | Calculation or Method | Best Used For | Main Limitation |
|---|---|---|---|---|
| Customer Satisfaction Score (CSAT) | Satisfaction with a specific experience | Percentage of positive survey responses | Support, purchases, onboarding | Captures immediate feedback, not long-term loyalty |
| Net Promoter Score (NPS) | Likelihood of recommending a company | % Promoters − % Detractors | Relationship tracking | Does not explain why customers give a particular score |
| Customer Effort Score (CES) | Ease of completing a task | Average survey score or percentage of favorable responses | Support, self-service, returns | Focuses on a particular task |
| Customer Lifetime Value (CLV) | Estimated value generated over a customer relationship | Average purchase value × frequency × lifespan | Retention and customer economics | Simplified revenue models exclude profitability |
| Customer Churn Rate | Percentage of customers lost during a period | Customers lost ÷ starting customers × 100 | Subscription and recurring-revenue businesses | Identifies losses after they occur |
| Customer Retention Rate | Percentage of existing customers retained | (Ending customers − new customers) ÷ starting customers × 100 | Loyalty and renewal performance | Can conceal differences between customer segments |
These metrics work best when evaluated together. A company may report strong customer satisfaction while losing valuable accounts, or improve retention while customer spending declines. Looking at several indicators helps reveal these differences.
How to Calculate the 6 Key CX Metrics
1. Customer Satisfaction Score (CSAT)
Customer Satisfaction Score measures how satisfied customers are with a product, service, or specific interaction. A typical CSAT survey asks: How satisfied were you with your experience today? Customers respond on a five-point scale, where 1 represents very dissatisfied and 5 represents very satisfied.
CSAT formula:
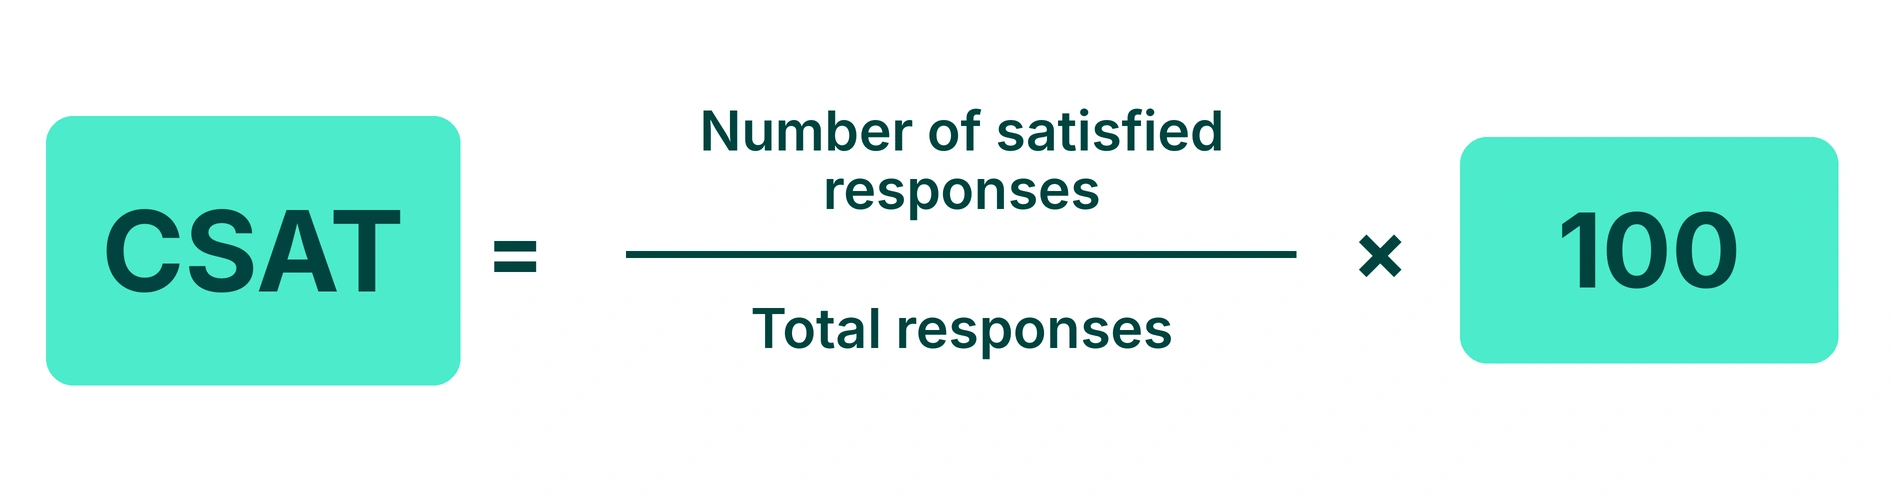
On a five-point scale, satisfied responses usually include ratings of 4 and 5.
Example: If 180 out of 220 customers give a rating of 4 or 5:
CSAT = (180 ÷ 220) × 100 = 81.8%
CSAT is particularly useful after support interactions, purchases, onboarding sessions, or service appointments. However, a high score does not necessarily mean customers will renew, make another purchase, or recommend your company. Survey response rates and differences between customer groups can also affect the results. Track CSAT by interaction type, channel, and customer segment. If satisfaction declines, compare the results with resolution times, repeat contacts, and agent quality scores.
For more context, see What Is a Good Customer Satisfaction Score?
2. Net Promoter Score (NPS)
Net Promoter Score measures how likely customers are to recommend a company, product, or service. The standard question is: How likely are you to recommend us to a friend or colleague? Customers respond on a scale from 0 to 10 and fall into three groups:
- Promoters (9–10): Customers most likely to recommend the company.
- Passives (7–8): Customers who are neither promoters nor detractors.
- Detractors (0–6): Customers least likely to recommend the company.
NPS formula:
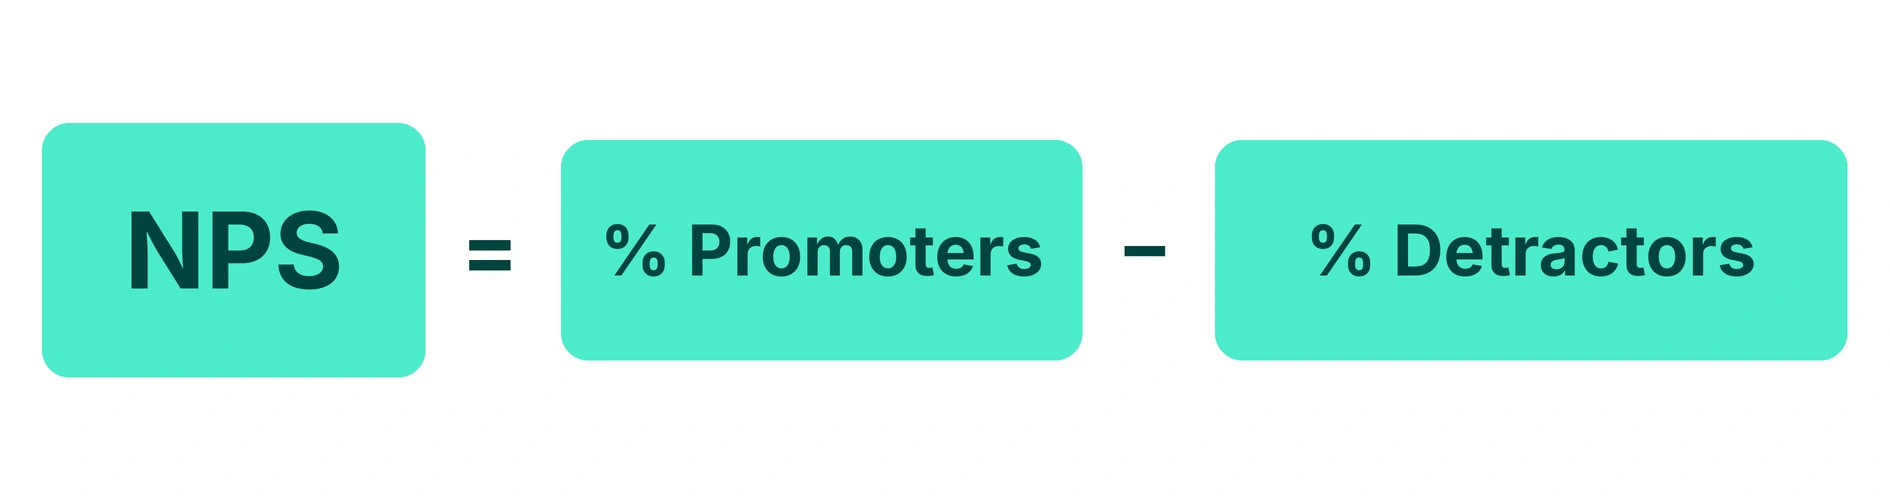
Example: Of 300 respondents, 165 are promoters (55%), 90 are passives (30%), and 45 are detractors (15%).
NPS = 55 − 15 = 40
The score ranges from −100 to +100. NPS is useful for tracking customer sentiment over time, particularly when businesses compare results across customer segments, products, and renewal cohorts. It is less useful as a standalone measure of financial performance. A customer may recommend a product but still leave because of pricing, changing needs, or competitive alternatives. Use follow-up questions to understand the reasons behind the score, and compare NPS trends with retention and churn data.
The Net Promoter System provides the standard methodology.
3. Customer Lifetime Value (CLV)
Customer Lifetime Value estimates the economic value a customer generates throughout their relationship with a business. CLV helps companies evaluate customer acquisition spending, retention investments, and the value of different customer segments.
CLV formula:
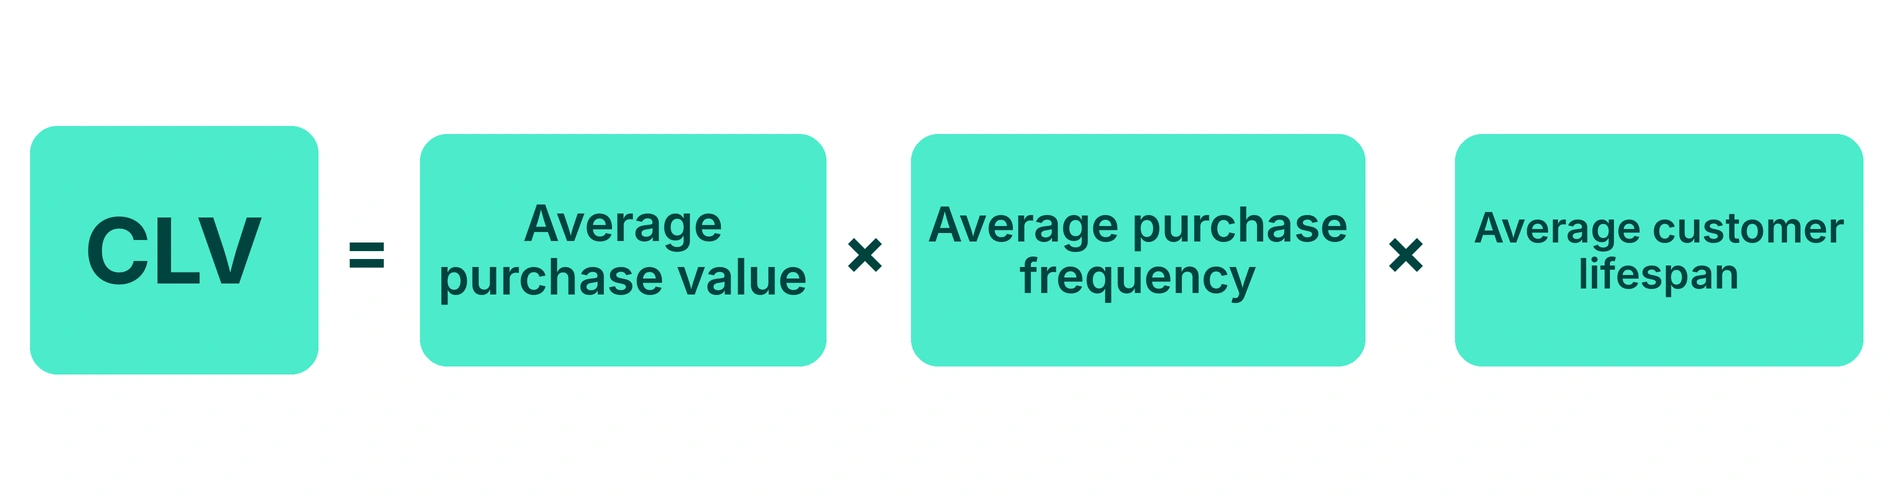
Example: A customer spends $120 per purchase, buys four times annually, and remains a customer for three years.
CLV = $120 × 4 × 3 = $1,440
This figure represents estimated lifetime revenue, not profit. To evaluate profitability, companies need to account for gross margin and, where relevant, the costs of acquiring and serving customers. Subscription businesses may also use more sophisticated models based on recurring revenue, retention probabilities, and discounted future cash flows. CLV becomes especially useful when analyzed alongside churn and retention. A company may retain most customers while losing its highest-value accounts, creating a revenue risk that overall retention rates do not reveal.
Learn more about the importance of customer lifetime value.
4. Customer Churn Rate
Customer churn rate measures the percentage of customers lost during a defined period. It helps subscription businesses, SaaS providers, financial services companies, and other recurring-revenue organizations understand customer attrition.
Customer churn formula:
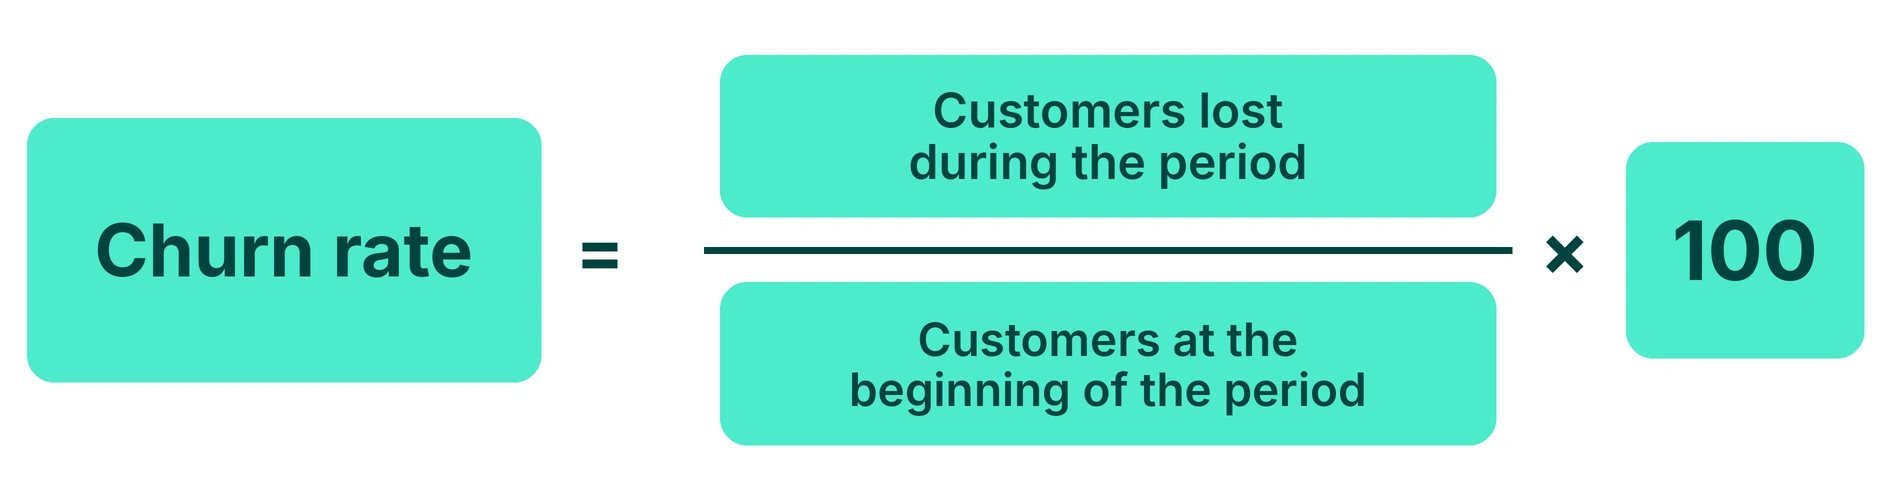
Example: A business starts the quarter with 2,000 customers and loses 90.
Churn rate = (90 ÷ 2,000) × 100 = 4.5%
New customers acquired during the period should not be included in the starting customer base. Churn provides an important warning about customer relationships, but it does not identify why customers leave. Businesses should investigate churn by product, account value, customer tenure, acquisition channel, and cancellation reason. For example, rising churn among newly onboarded customers may indicate difficulties with setup, product adoption, or early support interactions. Rising churn among long-standing customers may require a different investigation.
Read our guide on how to reducing customer churn.
5. Customer Retention Rate
Customer retention rate measures the percentage of customers who remain with a business over a defined period.
Customer retention formula:
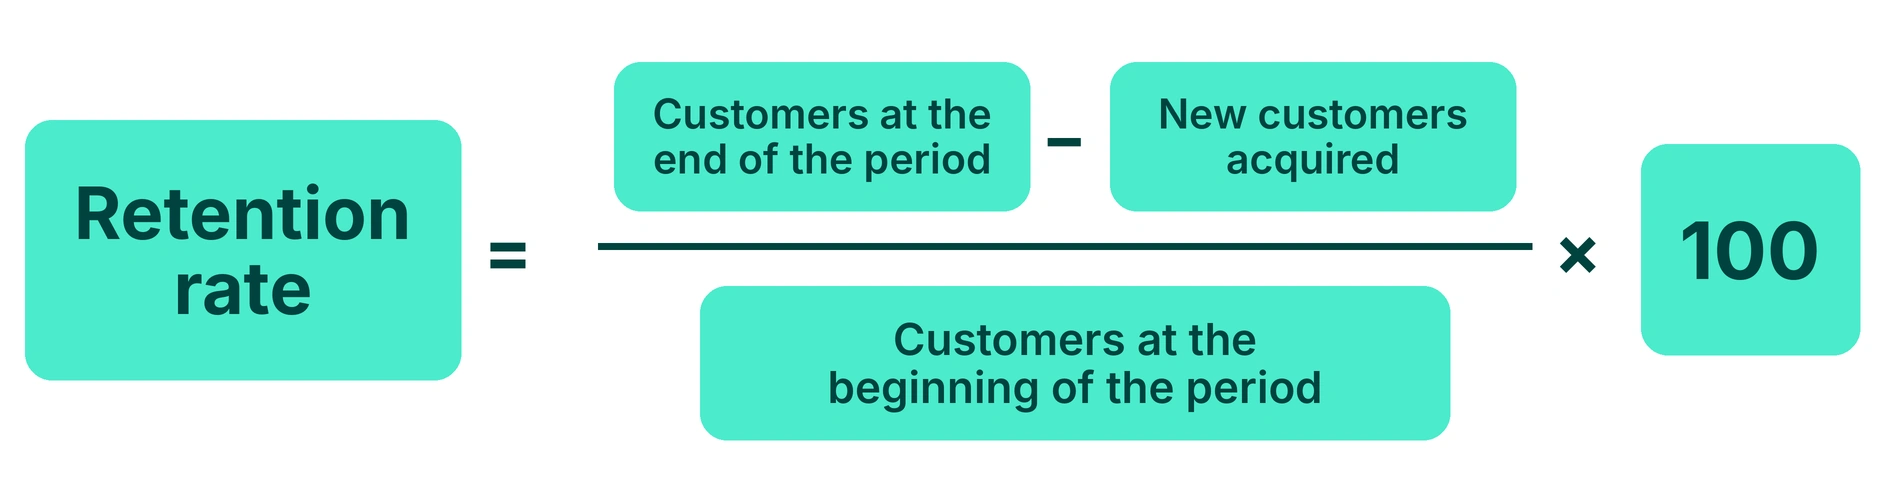
Example: A company starts a quarter with 2,000 customers, ends with 2,150, and acquires 240 new customers.
Retention rate = ((2,150 − 240) ÷ 2,000) × 100 = 95.5%
Using the same customer definitions and period, this corresponds to a churn rate of 4.5%. Retention is especially important for businesses that depend on repeat purchases, subscriptions, or contract renewals. However, a strong overall retention rate may conceal problems in particular customer segments. Analyze retention by account size, product, tenure, and revenue contribution to identify where improvements will have the greatest impact.
A structured customer retention management strategy connects these findings to onboarding, service delivery, and account management.
6. Customer Effort Score (CES)
Customer Effort Score measures how easy or difficult customers find a particular interaction or task. A common CES survey asks respondents to rate their agreement with a statement such as: The company made it easy for me to handle my issue. One widely used approach uses a seven-point agreement scale.
CES formula for an average-score method:
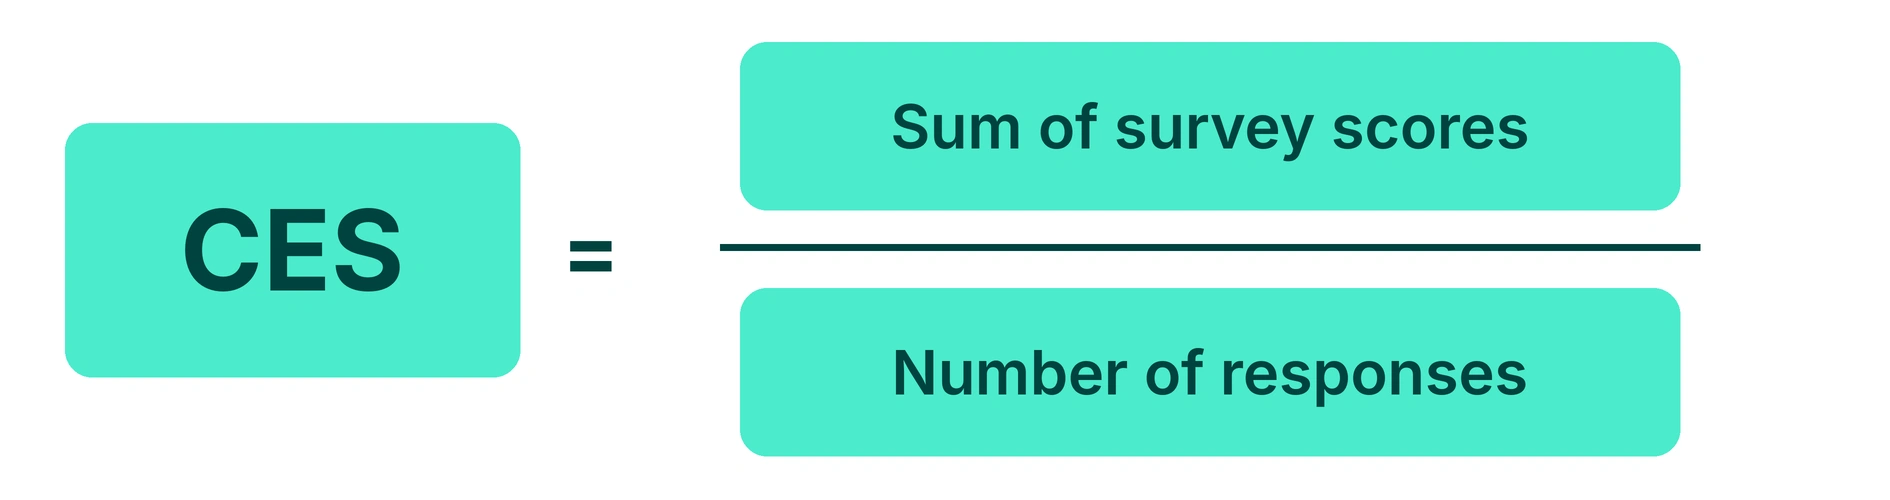
Example: If 400 responses produce a total score of 2,240:
CES = 2,240 ÷ 400 = 5.6 out of 7
CES does not have one universal survey scale or reporting method. Some organizations calculate the percentage of favorable responses instead of an average. Results should therefore be compared only when the question, scale, and calculation method are consistent. CES is particularly useful for evaluating support interactions, returns, account setup, identity verification, and self-service experiences. Low scores can indicate unnecessary transfers, repeated information requests, complicated procedures, or difficult-to-find answers.
Operational Metrics That Explain CX Performance
Customer feedback identifies where experiences may be improving or deteriorating. Operational metrics help teams investigate the processes behind those changes.
| Operational Metric | What It Measures | How It Supports CX Analysis |
|---|---|---|
| First Contact Resolution (FCR) | Percentage of issues resolved during the first interaction | Helps identify repeat-contact problems and ineffective resolution processes |
| Average Handle Time (AHT) | Average interaction time, including talk, hold, and after-contact work | Reveals efficiency changes that should be evaluated alongside quality |
| First Response Time (FRT) | Time until the first response to a customer inquiry | Helps assess accessibility and staffing performance |
| Time to Resolution (TTR) | Time required to resolve an issue | Highlights delays across teams, systems, or escalation processes |
| Quality Assurance (QA) Score | Performance against defined interaction standards | Connects coaching, accuracy, and process compliance to service quality |
No single operational metric should be optimized in isolation. For example, reducing average handle time may improve efficiency. But if repeat contacts rise or CSAT declines, shorter interactions may be creating additional work elsewhere. Similarly, strong first response times mean little if customers wait days for a complete resolution. A structured call center quality assurance program helps identify these trade-offs and determine which operational changes are improving the customer experience.
CX Metrics in Practice: Improving FCR and CSAT for a Healthtech Company
A healthtech company serving more than 20 million members faced fragmented support operations after a merger. Different systems, knowledge bases, and escalation procedures created confusion for agents and delayed issue resolution.
Helpware consolidated knowledge resources, introduced unified ticket management, and standardized training and escalation workflows.
The healthtech case study reports the following results within 90 days:
| Metric | Before | After |
|---|---|---|
| First Contact Resolution | 61% | 81% |
| Customer Satisfaction | 78% | 91% |
| Average Handle Time | 12.7 minutes | 7.1 minutes |
| SLA Adherence | 74% | 96% |
| Agent Ramp Time | 30 days | Approximately 17 days |
The results illustrate the value of tracking customer satisfaction alongside resolution efficiency and service delivery. In this engagement, improved FCR and lower handling times coincided with higher CSAT and stronger SLA performance. They also demonstrate why investigating knowledge management, ticket routing, and escalation processes can be more useful than treating an individual CX score as the problem.
How to Interpret CX Metrics and Identify Problems
Calculating CX metrics is relatively straightforward. Understanding what changes in those metrics mean requires more analysis. A decline in CSAT could reflect longer wait times, inaccurate responses, unresolved issues, or changing customer expectations. The score alone cannot distinguish between them.
Use the following scenarios as starting points for investigation.
| What the Data Shows | What It May Indicate | What to Investigate |
|---|---|---|
| CSAT falls while FCR remains stable | Customers receive resolutions but find the experience frustrating | Communication quality, wait times, transfers |
| CES declines and repeat contacts increase | Customers must invest more effort to resolve issues | Self-service gaps, handoffs, unclear instructions |
| NPS remains strong while churn increases | Positive sentiment is not translating into retention | Pricing, product fit, renewals, customer segments |
| AHT decreases while CSAT falls | Faster interactions may be affecting service quality | Premature closures, agent coaching, repeat contacts |
| Retention improves while CLV declines | Customers remain but generate less revenue | Purchase frequency, account value, customer mix |
| QA improves while CSAT remains unchanged | Internal quality standards may not reflect customer priorities | QA criteria, survey comments, unresolved customer needs |
These patterns are diagnostic hypotheses, not proof of causation. Validate them through interaction reviews, customer feedback, cohort analysis, and operational data.
Compare Metrics Across Channels and Customer Segments
Company-wide averages can hide substantial differences in customer experience. For example, an organization may report strong overall CSAT while customers contacting technical support experience significantly longer resolution times than those asking general account questions.
Analyze performance by:
- Channel: Phone, email, chat, social media, and self-service.
- Issue type: Billing, technical support, account access, returns, or complaints.
- Customer segment: New customers, long-term customers, enterprise accounts, or high-value customers.
- Journey stage: Onboarding, purchase, ongoing service, renewal, or cancellation.
An omnichannel customer experience approach makes it easier to compare interactions across channels and identify problems that would otherwise remain isolated within individual teams.
CX Metrics in Practice: Connecting Customer Feedback With Service Accuracy
In another healthcare customer support engagement, Helpware supported a medical equipment company across customer service and back-office workflows.
The engagement reported the following operational results for Q1 2025:
| Metric | Target | Reported Performance |
|---|---|---|
| Average Handle Time | Under 5 minutes | 4.63 minutes |
| Average Hold Time | Under 30 seconds | 17.33 seconds |
| Voice of Customer Score | Above 4.0 | 4.14 out of 5 |
| Order Accuracy | Above 99.5% | 99.5% |
| Case Completion | 100% | 100% |
This example shows why healthcare CX measurement should include both customer feedback and process accuracy. A Voice of Customer score provides insight into how customers perceive their interactions. Handle time, hold time, order accuracy, and case completion provide additional evidence about service delivery. The case also illustrates the importance of defining targets before evaluating performance. These figures are reported operational outcomes rather than a controlled demonstration that one metric caused another to improve.
How to Build a Customer Experience Measurement Framework
A customer experience measurement framework connects business objectives, customer feedback, operational data, and improvement decisions. The goal is to establish a repeatable process for identifying problems, assigning responsibility, and evaluating whether changes improve the customer journey.
1. Define the business outcomes you want to improve
Start with a specific objective rather than collecting every available CX metric.
For example:
- Improve customer retention after onboarding.
- Reduce repeat contacts for billing inquiries.
- Increase successful self-service resolutions.
- Improve customer satisfaction without increasing support costs.
Each objective should have a measurable baseline, target, and review period.
2. Select metrics for each customer journey stage
Different stages require different measures. Choose the measures that answer your business questions rather than applying every metric to every interaction.
| Journey stage | Primary CX metrics | Supporting operational metrics |
|---|---|---|
| Onboarding | CSAT, CES | Time to activation, onboarding completion |
| Customer support | CSAT, CES | FCR, FRT, TTR, QA |
| Self-service | CES | Task completion, self-service resolution |
| Renewal | NPS, retention | Renewal rate, escalation frequency |
| Long-term relationship | CLV, churn, retention | Repeat purchase frequency, account activity |
3. Connect Data Across Systems
CX information often sits in separate platforms: CRM systems, contact center software, survey tools, product analytics, and billing applications. Connecting these sources allows teams to examine relationships between customer feedback and operational performance. For example, combining support tickets with renewal data can help determine whether customers who experience repeated unresolved issues have different retention outcomes. Choose customer experience tools that support the reporting, integration, and governance requirements of your organization.
4. Establish a Consistent Measurement Schedule
Transactional metrics such as CSAT and CES can be collected continuously after relevant interactions. Relationship NPS may be measured periodically, while churn, retention, and CLV often require monthly or quarterly analysis. Use consistent survey questions, reporting periods, and customer definitions to make results comparable over time.
5. Include Digital and Third-Party Experiences
Customers increasingly seek help before contacting a company’s support team. Gartner’s research found that 51% of customer service journeys begin on third-party platforms, making reviews, community discussions, search visibility, and external self-service content relevant to CX measurement. Monitor these sources alongside your owned support channels, while distinguishing public sentiment and content accuracy from direct customer satisfaction measures.
6. Investigate Changes and Assign Ownership
When performance shifts, identify the affected customer segments and journey stages. Review relevant interactions, compare operational data, and determine which team owns the underlying process. For example, a rise in repeat contacts may require changes to the knowledge base, ticket routing, agent training, or product documentation.
7. Measure the Impact of Improvements
Track results after implementing changes and compare them with the original baseline. If a new knowledge management process reduces repeat contacts, determine whether it also improves CSAT, resolution times, and support workload. This closes the loop between measurement and operational improvement. For more practical approaches, see how to improve customer experience.
How Helpware Measures and Improves Customer Experience
Effective CX measurement requires access to reliable data, clear operational ownership, and the ability to act on what the results reveal. Helpware combines customer experience consulting with managed CX outsourcing services to help organizations assess customer journeys, manage support operations, and improve service performance.
Our teams work across customer support, technical support, quality assurance, and back-office processes, connecting customer feedback with the operational measures that influence service delivery.
In a healthtech engagement, Helpware unified knowledge management, ticket routing, and support workflows, helping increase first contact resolution from 61% to 81% and customer satisfaction from 78% to 91% within 90 days.
Our CX strategy and design services help organizations establish measurement priorities, identify gaps across customer journeys, and define operational improvements aligned with business objectives.